
PHOTOGRAPH © VARKEY FOUNDATION
Reading Between The Lines
What The World Really Thinks of Teachers
In the GTSI 2018 report, we examined the relationship between our combined GTSI measure and the most recent PISA scores that were available at the time of writing (PISA 2015). Since that report was published, PISA scores from the tests pupils sat in 2018 have become available. These are much more directly relevant to measures in the GTSI 2018 survey, which was conducted in the same year. In this report we therefore update our previous analysis of the relationship between teacher status and student outcomes as measured by PISA scores. Here we also expand on our previous analysis by comparing the predictive power of our three alternative measures of teacher status. Based on our previous results, we expect that countries where teachers enjoy higher status will also have better student attainment.
Creating the GTSI score
The GTSI score was created using Principal Component Analysis (PCA). Through PCA, we examine the correlation between people’s responses to a variety of different survey questions, and accordingly determine whether these can be explained by a smaller number of underlying factors.
We applied a PCA model to the following four questions that were asked in the GTSI survey:
- Ranking primary school teachers against other professions.
- Ranking secondary school teachers against other professions.
- Ranking of teachers according to their relative status based on the most similar comparative profession.
- Perceived pupil respect for teachers.
The PCA reduced these four factors to a single fundamental measure of teacher status, which we re-scaled to produce a 0-100 score representing the status of teachers in each country. Full details of the statistical methodology and construction of the index may be found in the technical appendices of the GTSI 2018 report.
Teacher Status and PISA Scores: The Relationship
Figure 4 replicates our primary analysis from the GTSI 2018 report by plotting each country’s average GTSI 2018 score against its PISA 2018 score. The overall PISA score given in these figures is the mean average of each country’s absolute scores in Reading, Science, and Mathematics. The GTSI 2018 score represents our attempt to compile a single, global measure of teacher status for each country. It is not one of the three alternative measures of status we focus on in this report, but is included as an update of our findings as reported in the main GTSI 2018 report.
Figure 4 shows that there is a positive relationship between the 2018 GTSI and PISA scores. Countries in which our global measure indicates that teachers enjoy high status also tend to do better in the PISA assessments. However, this relationship is not particularly strong: The correlation coefficient is 0.28, indicating a moderate correlation. The R squared statistic reported on the chart is 0.08, indicating that around 8% of the variation in PISA scores between countries is explained by differences in teacher status as measured by GTSI 2018.
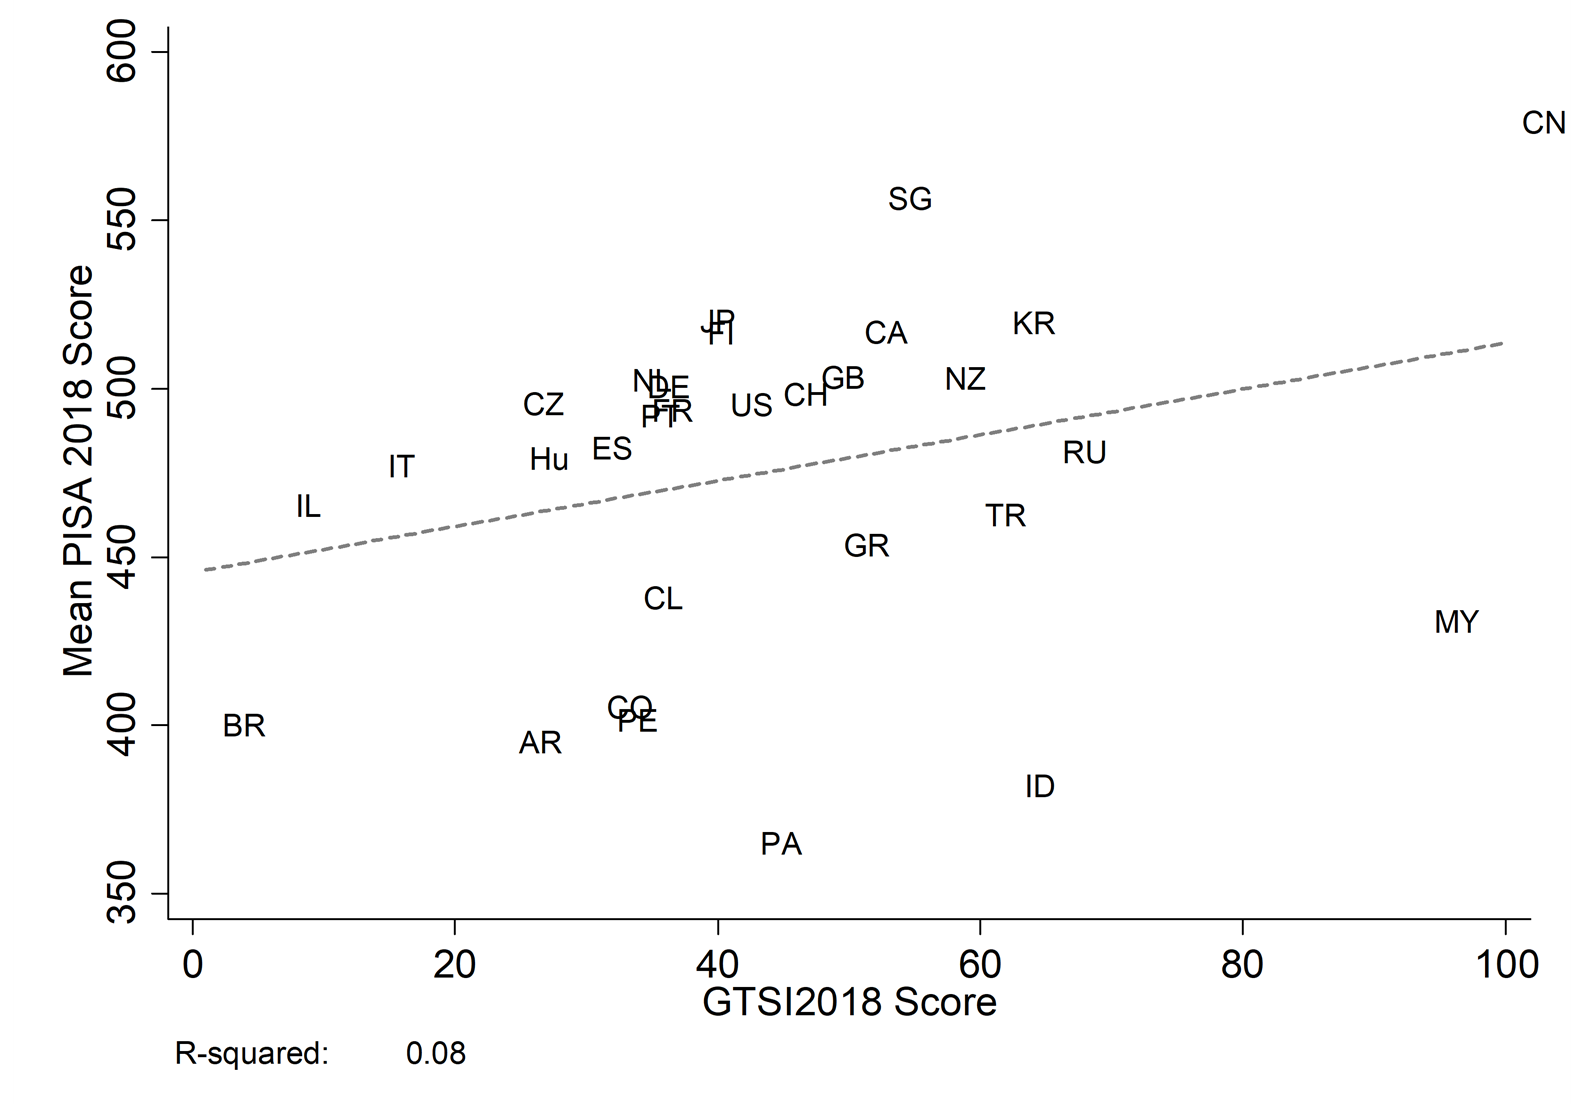
Figure 4
Scatterplot of country mean GTSI 2018 score against PISA 2018 scores
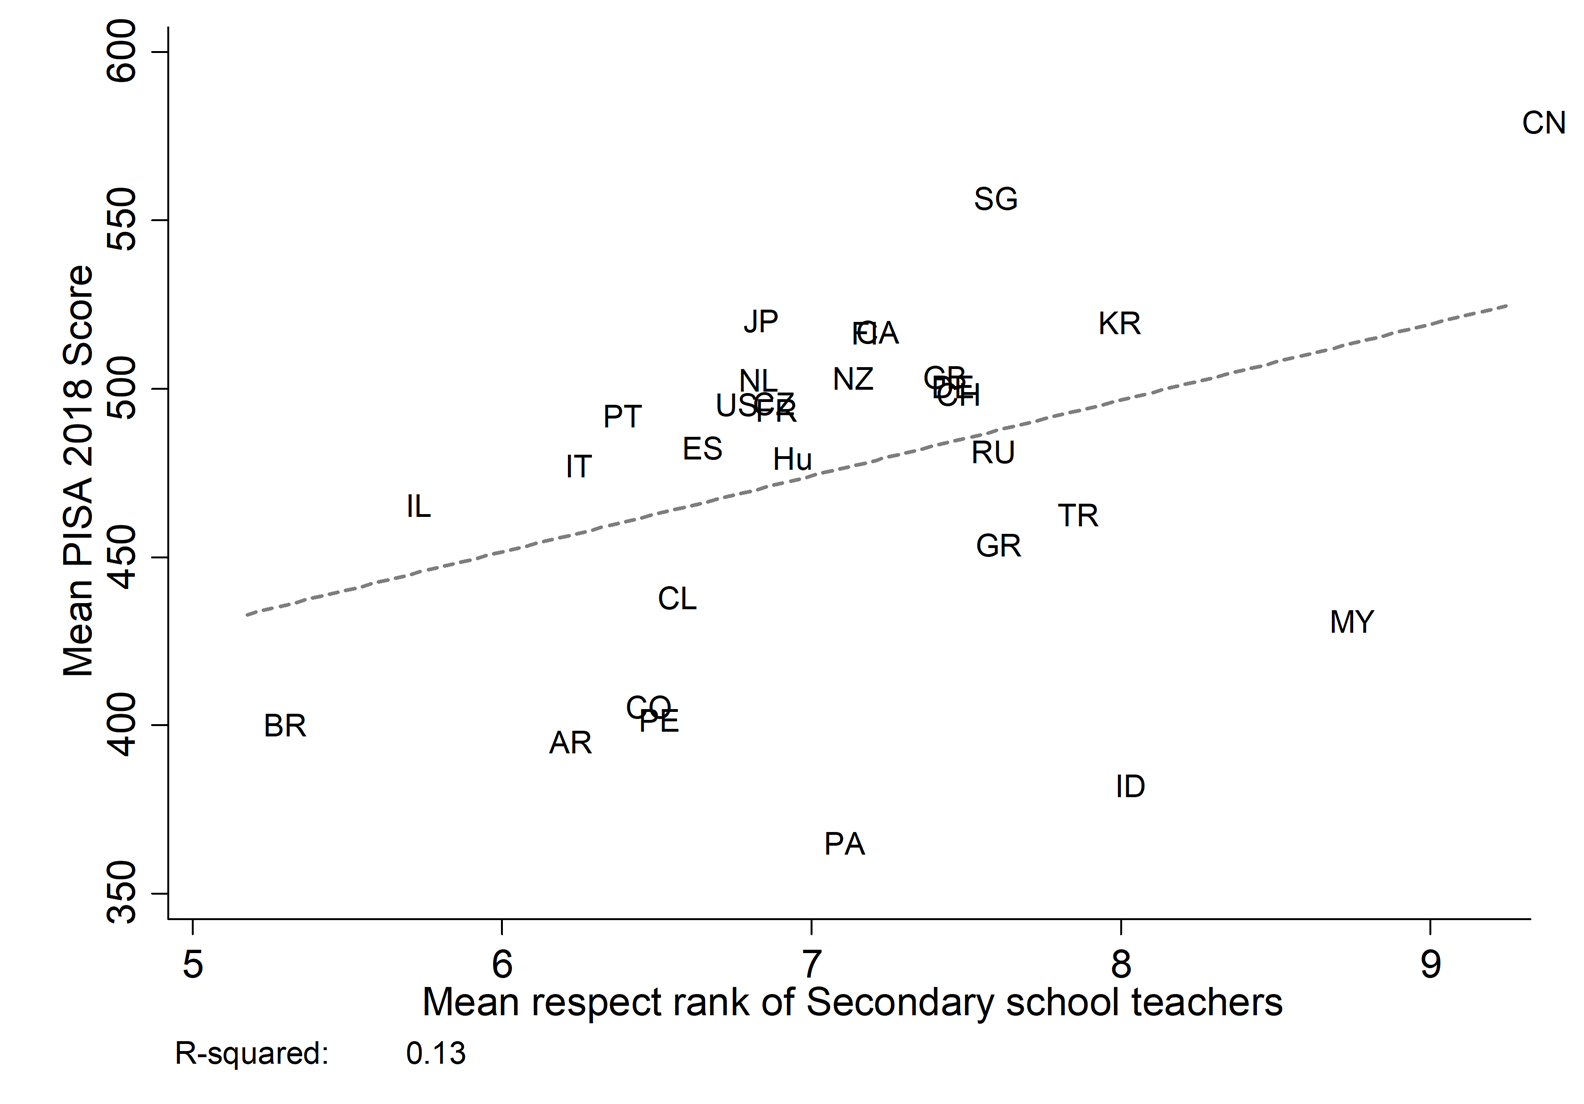
Figure 5
Scatterplot of mean secondary teacher respect rank against PISA 2018
Figures 5-7 show the same relationship between teacher status and PISA scores, but for each of our three measures of teacher status separately. For the ranking measure, we focus on secondary teachers specifically as PISA tests are administered to secondary school age students (aged 15).
Figures 5-7 show that, of the three teacher status measures, Implicit Teacher Status scores are the strongest predictor of PISA outcomes. The correlation between Implicit Teacher Status scores and PISA outcomes is remarkably strong (a correlation coefficient of 0.55), with the R-squared value showing that almost a third (0.31) of the variation in PISA scores can be explained by this measurement of teacher status. There is also a moderately strong correlation (a correlation coefficient of 0.36, an R-squared of 0.13) between Ranked Teacher Status and PISA scores. The relationship between our Explicit Teacher Status measure and PISA scores is considerably weaker (a correlation coefficient of 0.17, an R-squared of 0.03). From these results, it appears that the extent to which teachers are implicitly respected and admired is considerably more important for student outcomes than explicit evaluations of teacher quality and working conditions. This is a surprising finding, given that one might expect evaluations of teacher quality and working conditions to have a closer relationship with PISA scores, which are often considered to be an indicator of the quality of teaching and support students receive.
For the purposes of comparison, Figure 8 shows the relationship between PISA scores and the amount that secondary school teachers are paid in equivalent USD.[1] This figure shows that teacher wages are a strong predictor of PISA scores. However, notably, they are not as strongly related to PISA scores as our measure of Implicit Teacher Status.
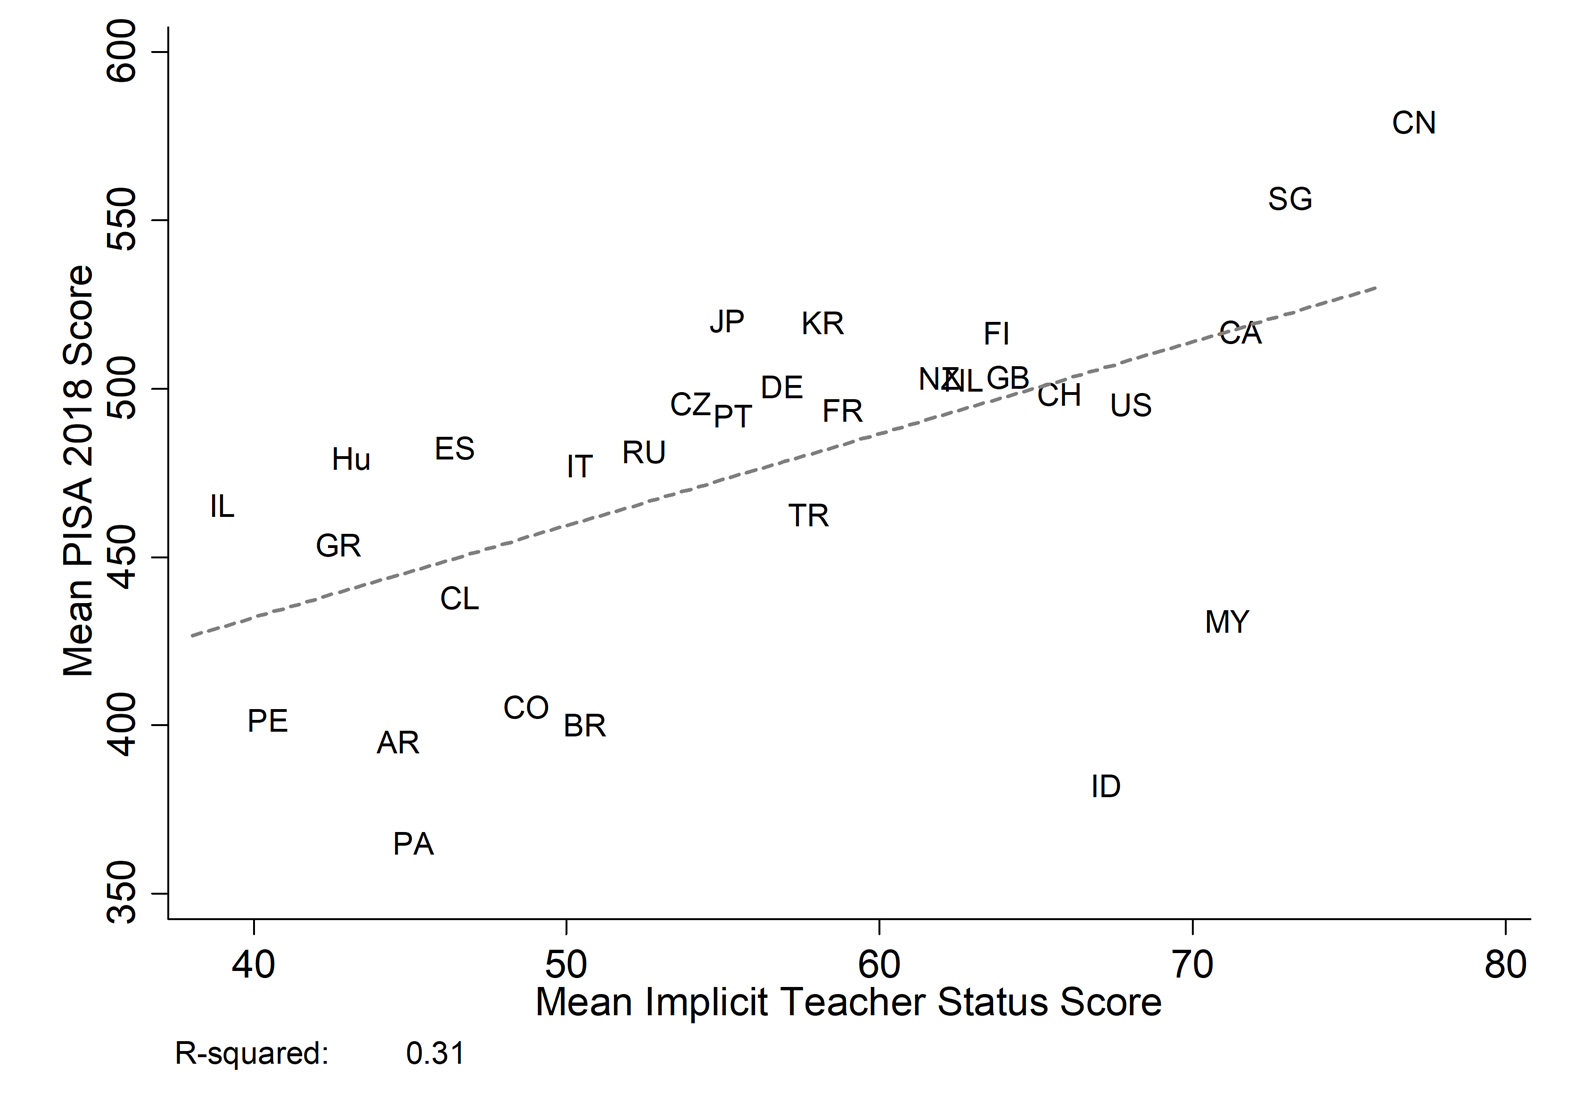
Figure 6
Scatterplot of mean Implicit Teacher Status score against PISA 2018
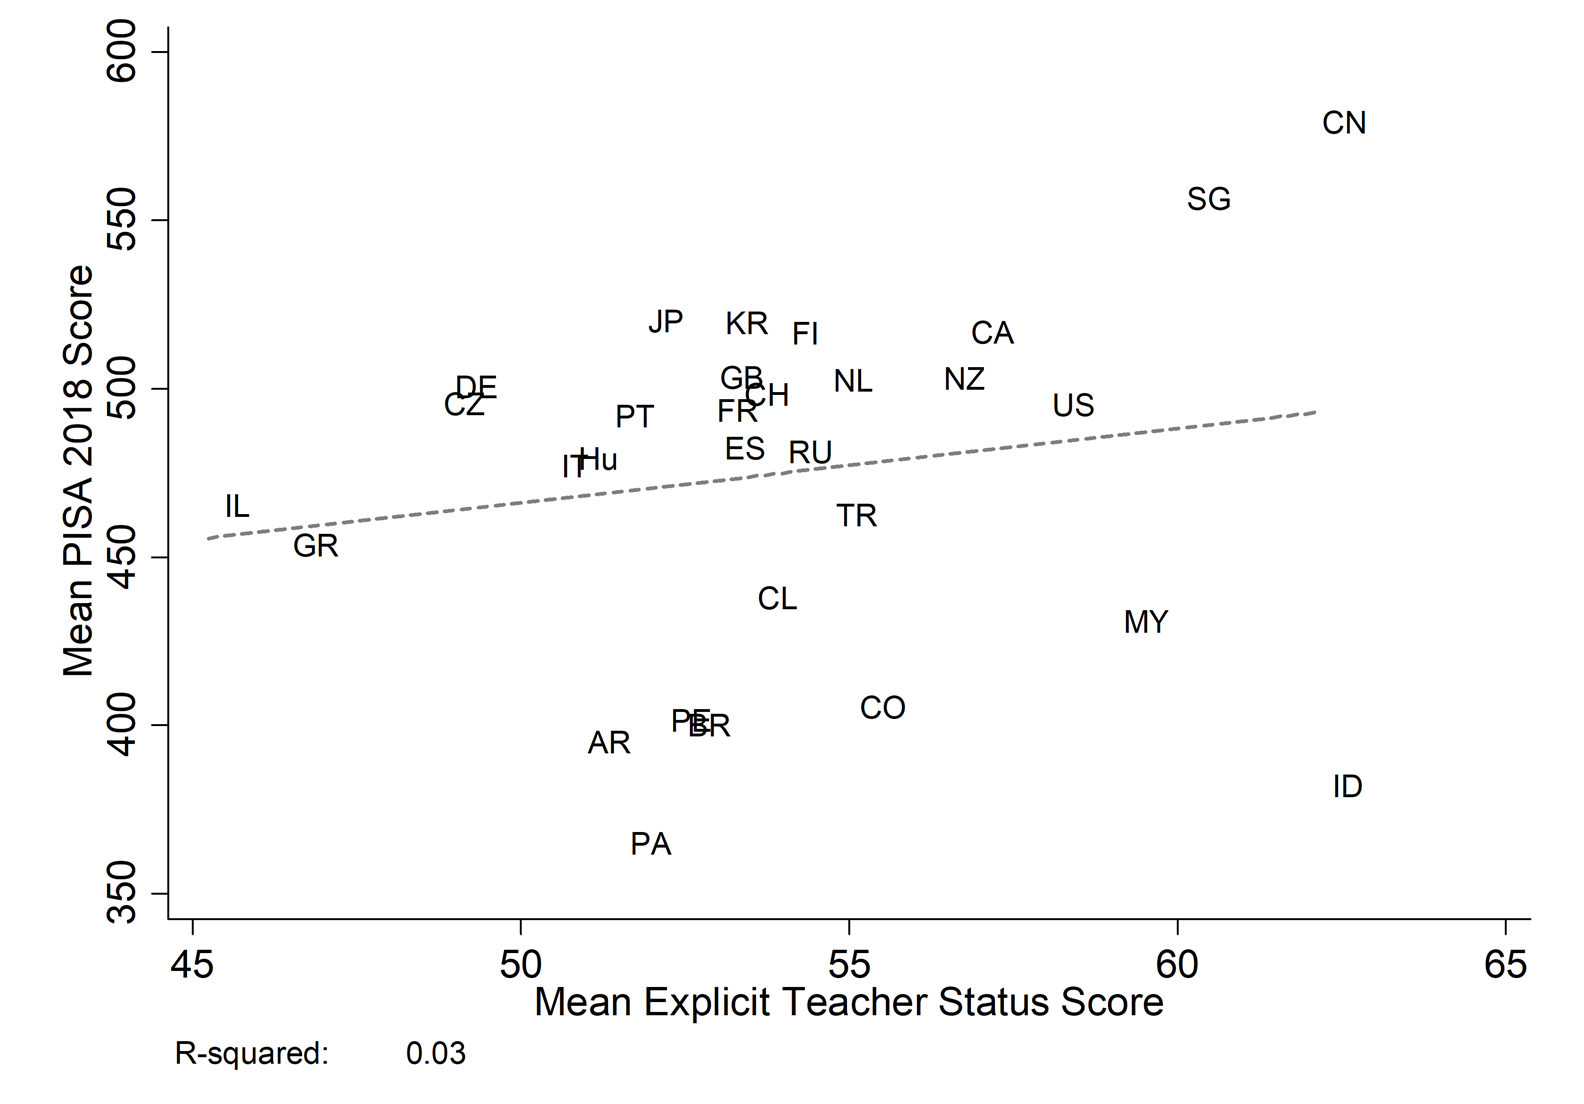
Figure 7
Scatterplot of mean Explicit Teacher Status score against PISA 2018
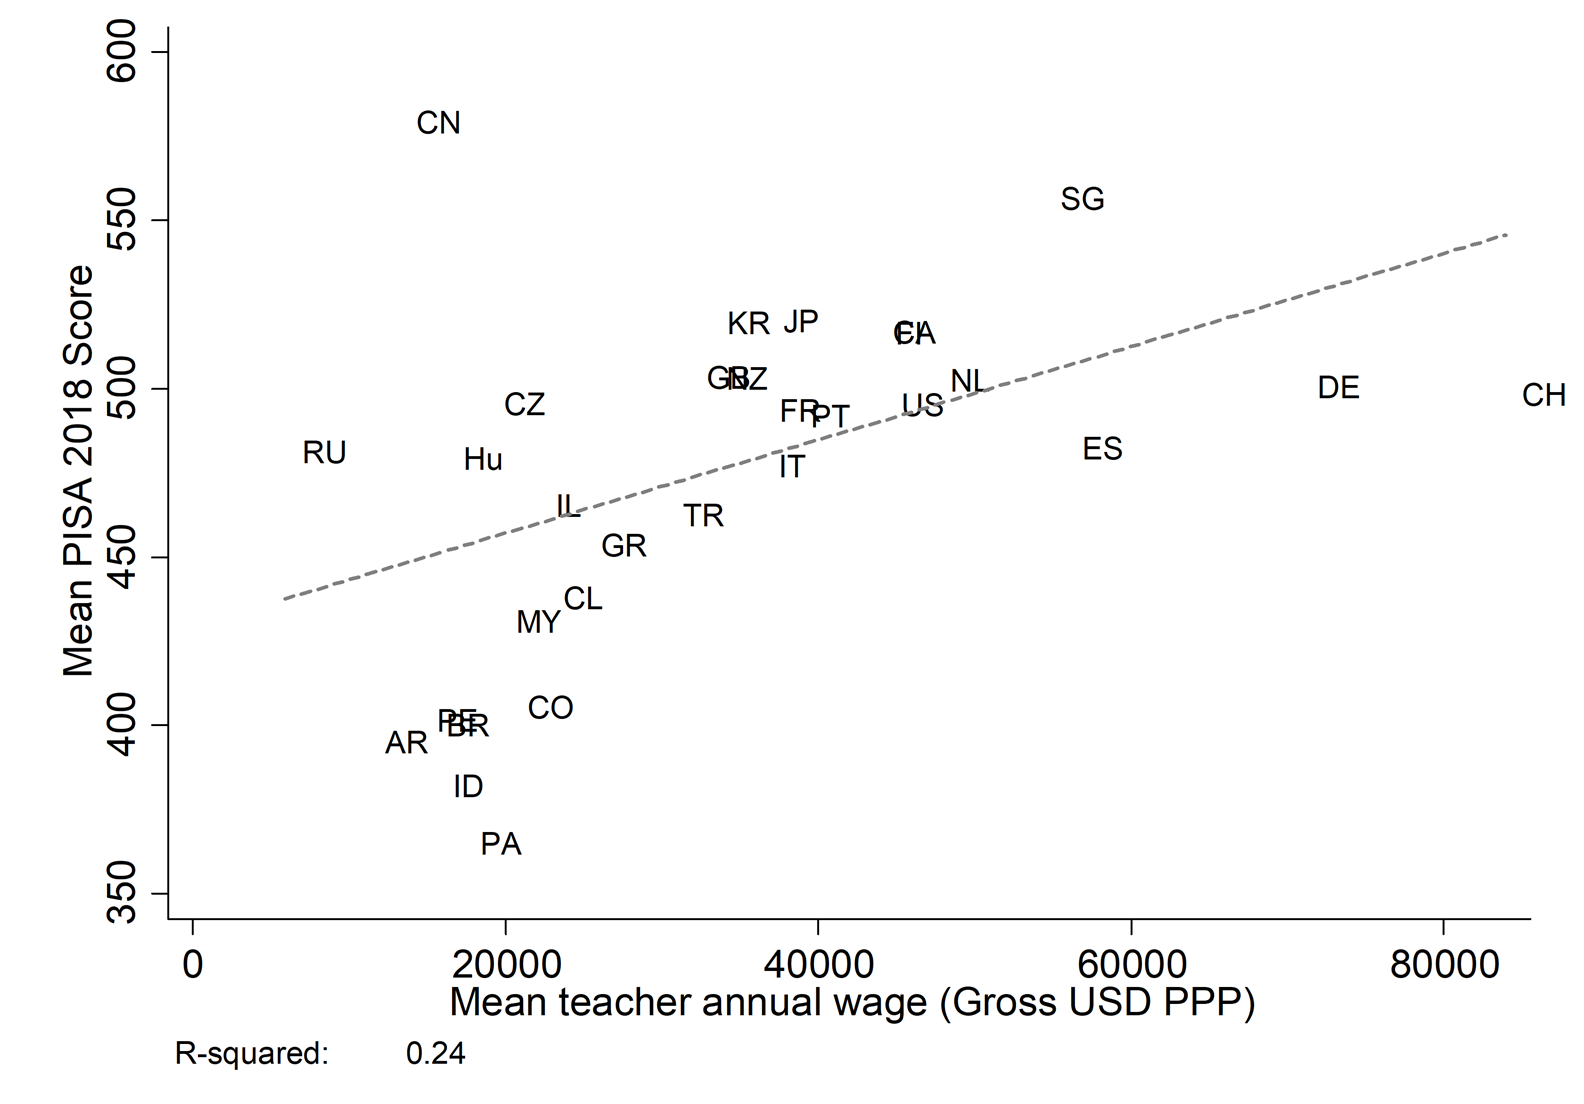
Figure 8
Scatterplot of mean annual secondary school teacher wage against PISA 2018
The analyses reported above examine only the straightforward, bivariate relationship between teacher status and pay and PISA scores. By contrast, Table 4 shows the results of a series of linear regression models predicting PISA 2018 scores from each of our measures of teacher status (and from perceived teacher pay rank) while holding constant average teacher wages. This table shows a clear relationship between the respect ranking of teachers and PISA scores: Countries in which secondary school teachers are ranked one place higher score 21.3 points better in PISA on average. By contrast, the perceived pay of teachers does not strongly predict PISA scores.
Table 4. Regression analysis of PISA 2018 scores on status score alternatives
| (1) Respect rank | (2) Pay rank | (3) Implicit score | (4) Explicit score | (5) GTSI 2018 | ||||||
|---|---|---|---|---|---|---|---|---|---|---|
| Teacher wage | 0.00152*** (3.24) |
0.00170*** (3.11) |
0.00106** (2.15) |
0.00156*** (3.12) |
0.00164*** (3.46) |
Respect rank: 0.00152*** (3.24) |
Pay rank: 0.00170*** (3.11) |
Implict score: 0.00106** (2.15) |
Explicit score: 0.00156*** (3.12) |
GTSI 2018: 0.00164*** (3.46) |
| Respect rank | 21.28** (2.24) |
26.12** (2.16) |
- | - | - | Respect rank: 21.28** (2.24) |
Pay rank: | Implict score: | Explicit score: | GTSI 2018: |
| Pay rank | - | 9.483 (-0.66) |
- | - | - | Respect rank: | Pay rank: 9.483 (-0.66) |
Implict score: | Explicit score: | GTSI 2018: |
| Implicit score | - | - | 2.082** (2.66) |
- | - | Respect rank: | Pay rank: | Implict score: 2.082** (2.66) |
Explicit score: | GTSI 2018: |
| Explicit score | - | - | - | 2.178 (1.04) |
- | Respect rank: | Pay rank: | Implict score: | Explicit score: 2.178 (1.04) |
GTSI 2018: |
| GTSI2018 | - | - | - | - | 0.779** (2.12) |
Respect rank: | Pay rank: | Implict score: | Explicit score: | GTSI 2018: 0.779** (2.12) |
| Constant | 279.7*** (4.13) |
295.3*** (4.08) |
327.0*** (8.04) |
310.7** (2.76) |
392.4*** (17.11) |
Respect rank: 279.7*** (4.13) |
Pay rank: 295.3*** (4.08) |
Implict score: 327.0*** (8.04) |
Explicit score: 310.7** (2.76) |
GTSI 2018: 392.4*** (17.11) |
| Observations | 30 | 30 | 30 | 30 | 30 | Respect rank: 30 | Pay rank: 30 | Implict score: 30 | Explicit score: 30 | GTSI 2018: 30 |
| R2 | 0.374 | 0.384 | 0.411 | 0.286 | 0.364 | Respect rank: 0.374 | Pay rank: 0.384 | Implict score: 0.411 | Explicit score: 0.286 | GTSI 2018: 0.364 |
Matching the results reported in Figure 6, above, our Implicit Teacher Status measure also strongly predicts PISA scores, even after accounting for teacher wages: Countries where the Implicit Teacher Status score is 10 points higher (on our scale of 0-100) would be predicted to score 20.8 points higher on the PISA assessments. Also reflecting the above results, our Explicit Teacher Status score is not strongly predictive of PISA scores.
In addition to these findings, we also found that our existing GTSI 2018 score was a significant determinant of PISA attainment. This is an important result as it mirrors our findings from the 2013 and 2018 GTSI reports. This is notable because it shows that the relationship between teacher status and PISA scores remains robust over two different surveys of teacher status (GTSI 2013 and GTSI 2015) and three different PISA rounds.
[1] See the technical appendices to the GTSI 2018 report for a full explanation of how teacher pay was derived.