
PHOTOGRAPH © SAMUEL ISAIAH
Reading Between The Lines
What The World Really Thinks of Teachers
In this investigation we explore three different methods for measuring the status of teachers: Ranked, Implicit and Explicit. In this section we explain the rationale for these three different measures and how they were computed.
Ranked Teacher Status
Our first measure of teacher status is based on a ranking of occupations in relation to each other. GTSI 2018 respondents were asked to rank the following 14 professions in the order of how well they thought were respected (with 14 being the highest and 1 being the lowest):[1]
- Primary school teacher
- Secondary school teacher
- Head teacher
- Doctor
- Nurse
- Librarian
- Local government manager
- Social worker
- Website designer
- Police officer
- Engineer
- Lawyer
- Accountant
- Management consultant
These occupations were deliberately chosen to require at least secondary education along with further training (which for the majority will be a degree, but for others will be professional training). The occupations were also carefully selected to cover a variety of different types of work in both the private and public sectors.
The rationale for this measure is that respondents are not required to make an explicit quantitative judgement about any specific occupation on any set dimension. Rather, the ranking measure taps into a more instinctive sense of which occupations are more or less prestigious. This is similar to the rationale for widely used CAMSIS measure of occupational status (Prandy and Jones, 2001).
The average rank for each occupation across all countries is given in Table 1.
Table 1: Average status rank across all countries
| Occupation | Average Rank |
|---|---|
| Doctor | 11.6 |
| Lawyer | 9.5 |
| Engineer | 9.1 |
| Head teacher | 8.1 |
| Police officer | 7.8 |
| Nurse | 7.4 |
| Accountant | 7.3 |
| Local government manger | 7.3 |
| Management consultant | 7.1 |
| Secondary school teacher | 7.0 |
| Primary school teacher | 6.4 |
| Web designer | 5.9 |
| Social worker | 5.8 |
| Librarian | 4.6 |
This table shows that headteachers are, on average, ranked among the top four occupations, but that secondary and primary teachers are near the bottom, above only librarians, social workers and web designers. However, these averages disguise a high degree of heterogeneity between countries, as can be seen in Figure 1, below, which shows the average ranking accorded to each type of teacher in each of the countries participating in GTSI 2018.
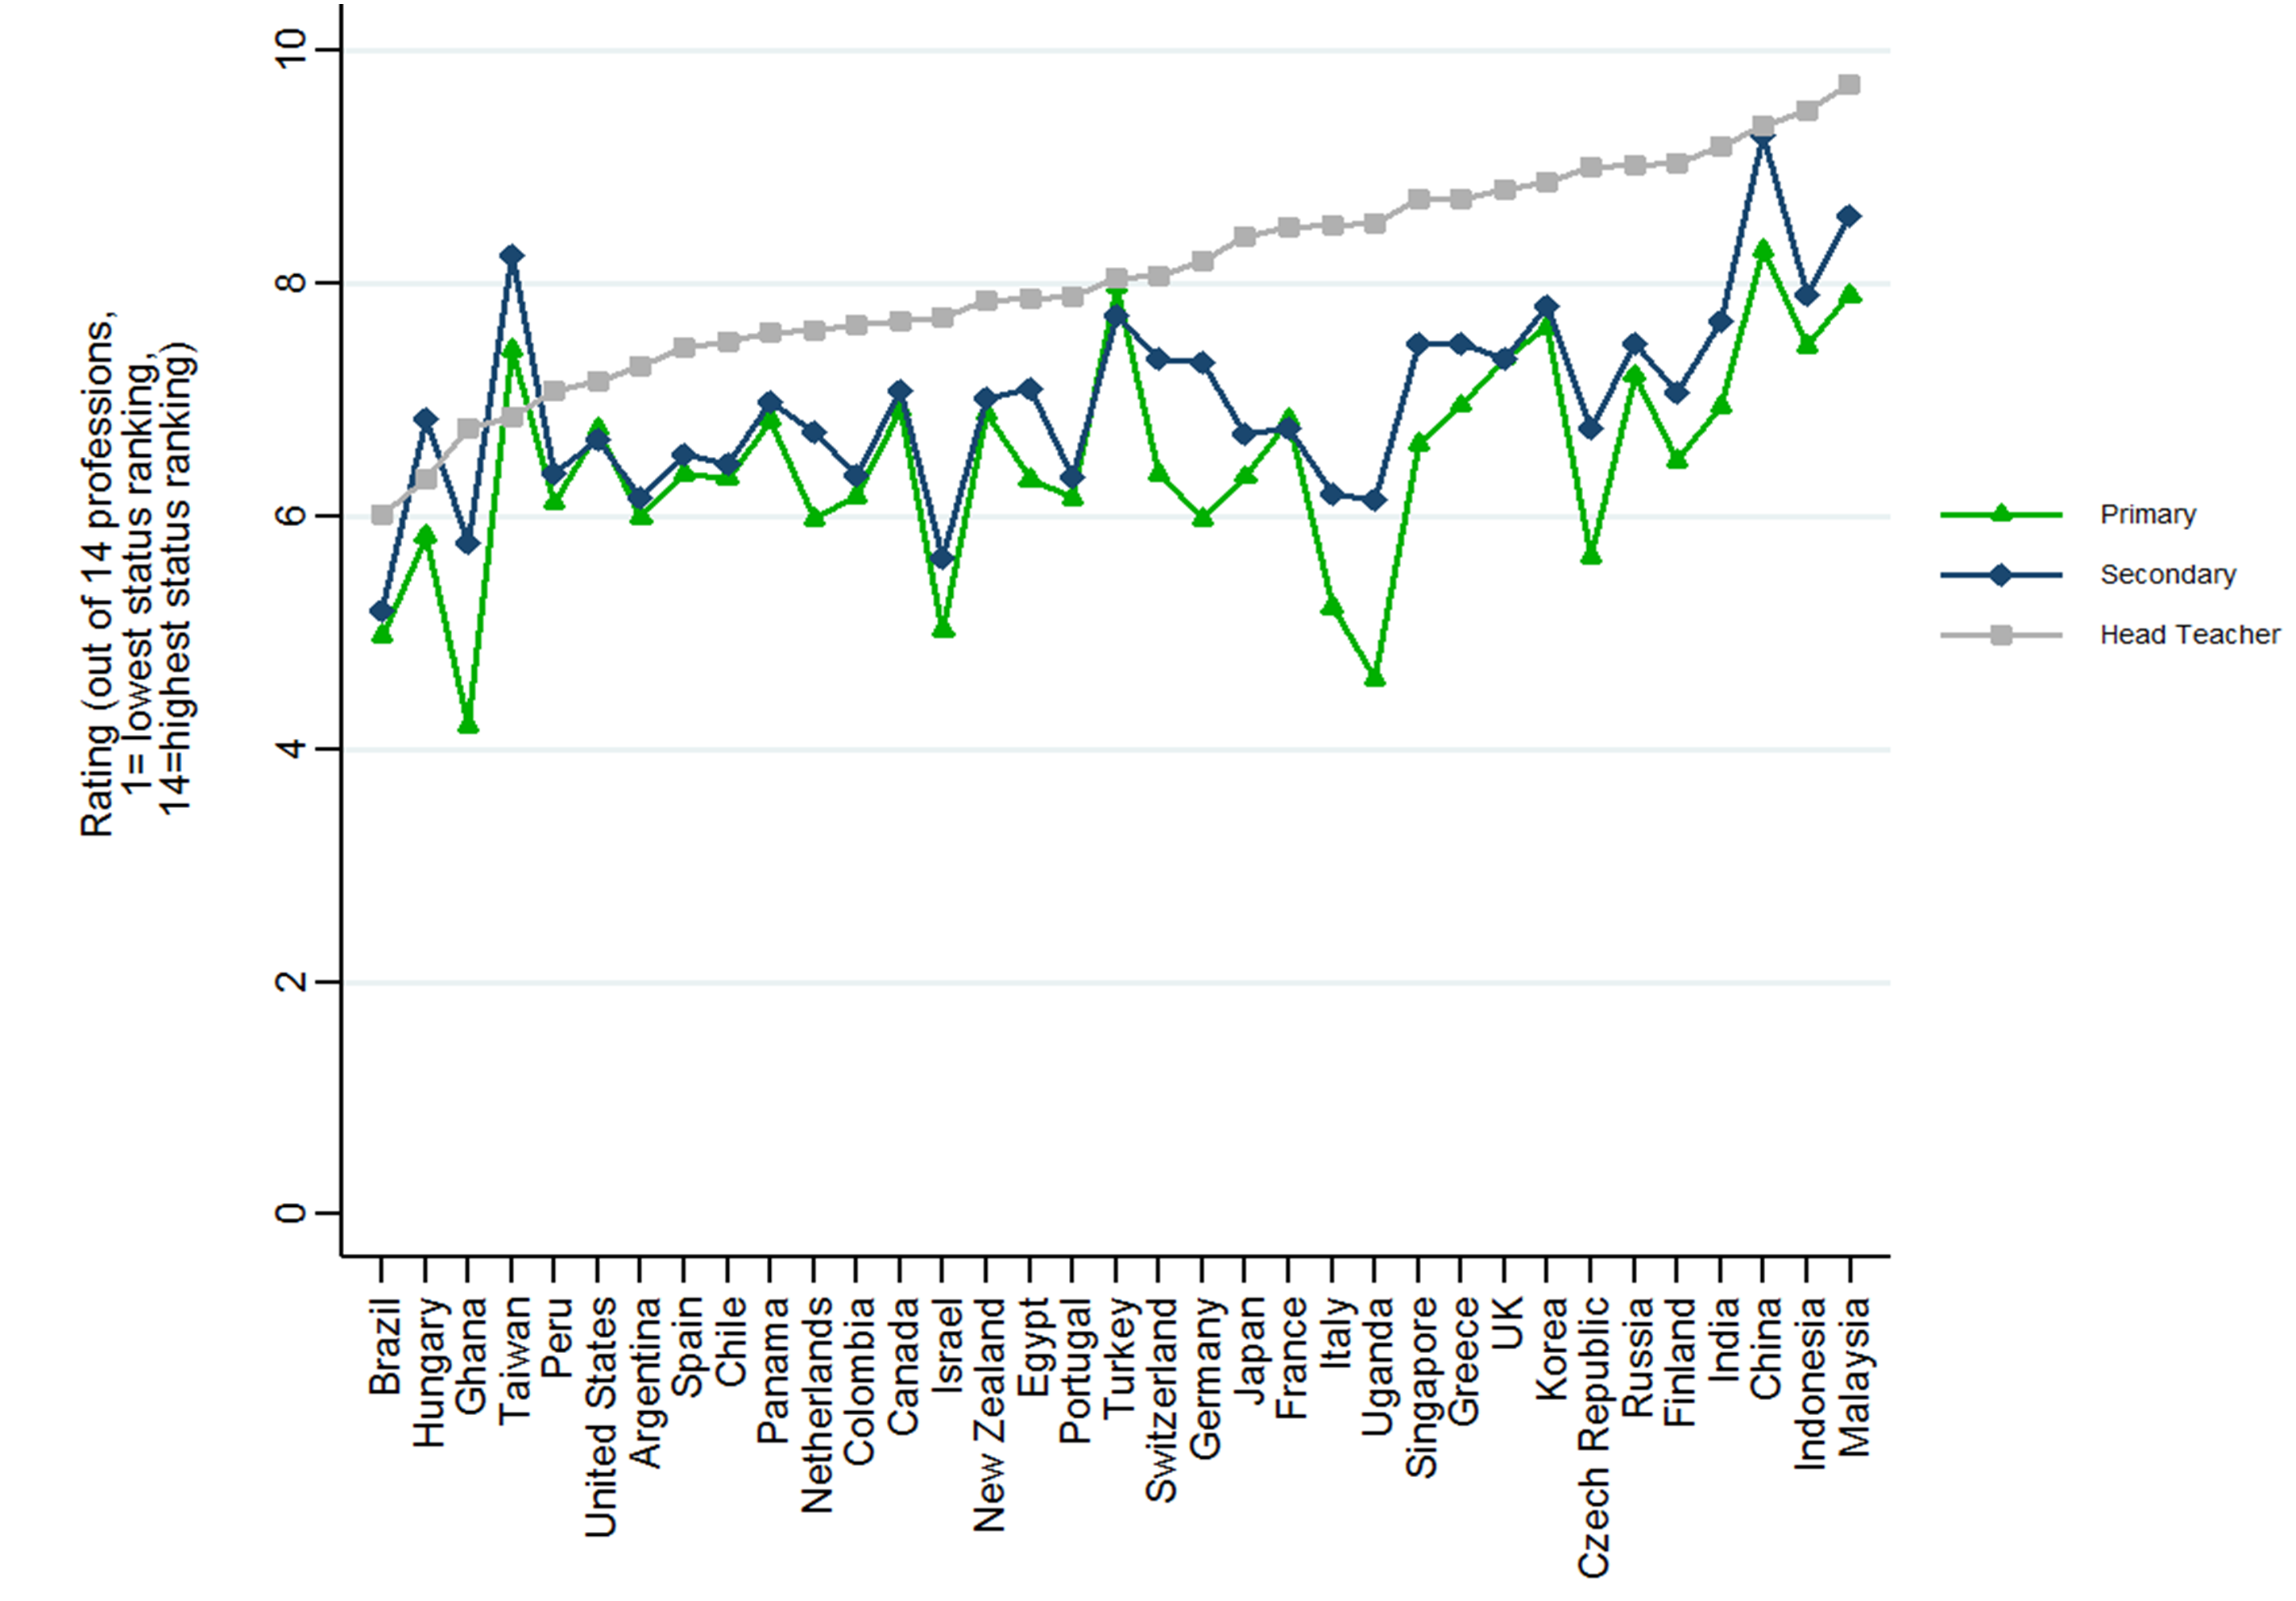
Figure 1
Headteacher, secondary teacher and primary teacher occupational respect rankings by the general public across countries
Figure 1 shows some consistent patterns: headteachers were perceived as more highly respected than secondary teachers in every country except Taiwan and Hungary. Secondary teachers were perceived as more highly respected than primary teachers in every country except Turkey, the USA, and France. However, there are pronounced differences between countries in the status rank of teachers. Focusing on secondary teachers specifically, at the bottom of the scale in Brazil and Israel, they are on average ranked only fifth out of the 14 occupations. Whereas in China and Malaysia, at the other end of the scale, secondary teachers are ranked eighth or ninth.
It is these variations in teacher status (as measured by ranking measurement as well as by our implicit and explicit measurements) that we explore in this report. What explains why teachers are accorded so much more respect in some countries than others? And what are the implications of teacher status for students? Do students in countries where teachers are highly respected perform better?
Implicit Teacher Status
Our second measure of occupational status is an attempt to tap into respondents’ implicit (unconsidered, automatic) impressions of teachers. This is measured using a sequence of word associations. Respondents were asked to, as quickly as possible, indicate which one of the following pairs of opposite words they most associated with teachers:
- Trusted/Untrusted
- Well paid/Poorly paid
- Influential/Not influential
- Inspiring/Uninspiring
- Respected/Not respected
- High status/Low status
- Hard working/Lazy
- Caring/Uncaring
- High flyer/Mediocre
- Intelligent/Unintelligent
To create our measure of Implicit Teacher Status we combined information on whether the respondent gave a positive or negative response with information on how long they took to respond. Positive responses were given a positive score, and negative responses a negative score. The value of the score depended on the time taken to respond: responses given in under two seconds were given a score of +5 or -5 (depending on whether the response was positive or negative), responses given in two to four seconds were given a score of +4/-4, responses in four to six seconds a score of +3/-3, responses in six to eight seconds a score of +2/-2, and responses between eight to 10 seconds a score of +1/-1. Responses after 10 seconds were given a score of zero. These scores were summed and then rescaled to give a score from 0-100. In this way, quicker responses were assumed to be indicative of a more decisive view.
People who rank secondary school teachers highly also tend to rank primary school teachers highly. However, ranking of primary and secondary school teachers is much more weakly correlated with the ranking of headteachers.
The rationale for this measure is based on a large volume of psychological research demonstrating that people’s spontaneous, unreflective feelings can be quite different to their deliberate, considered attitudes (Mayerl, 2013). In an often-studied example, spontaneous measures find evidence of negative attitudes towards ethnic minorities which are not picked up by conventional survey questions (Banaji, 2013).
This may be a consequence of social desirability bias: when asked a conventional survey question, respondents give the answer they think will reflect best on them, rather than their true feelings (Dovidio et al., 1997). Or it may be because the negative attitudes in question are largely implicit. Implicit attitudes are unconscious, automatically activated feelings and associations we hold in relation to certain subjects or groups (Greenwald et al., 1998). For example, consciously we may genuinely believe that women are no less technically competent than men. However, due to persistent exposure to sexist stereotypes, unconsciously we may associate greater technical competence with men (Moss-Racusin et al., 2012).
The majority of the previous literature on the difference between spontaneous and deliberate attitudes has focused on negative feelings about traditionally stigmatised groups (Banaji, 2013). Teachers clearly do not fit this description. However, precisely the same processes may apply to teachers as to other groups. When asked conventional survey questions, respondents may feel a social pressure to give a positive view of teachers, even if their true feelings or beliefs are quite different. Respondents may also hold positive or negative unconscious perceptions of teachers – feelings and associations of which they themselves are not fully aware. Measures which encourage spontaneous, reflexive responses may therefore offer an additional insight into the popular perception of teachers in the survey countries.
Figure 2 shows the average of this score across the countries in our sample.
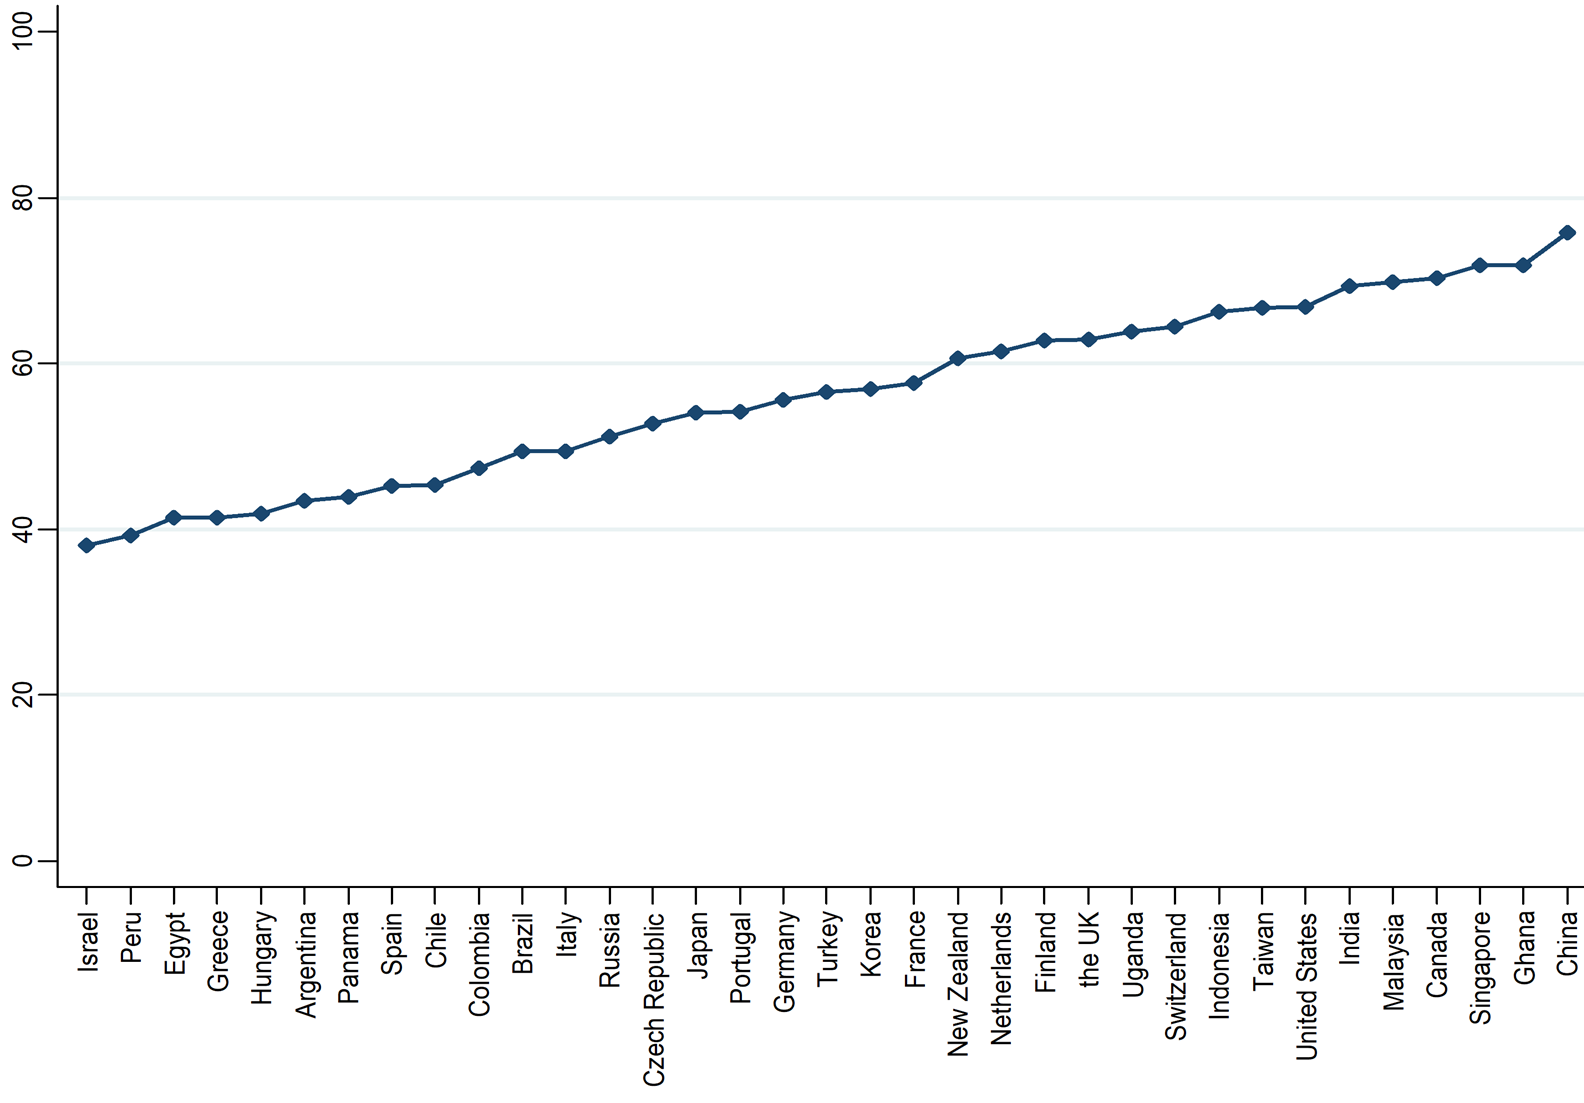
Figure 2
Mean Implicit Teacher Status scores across countries
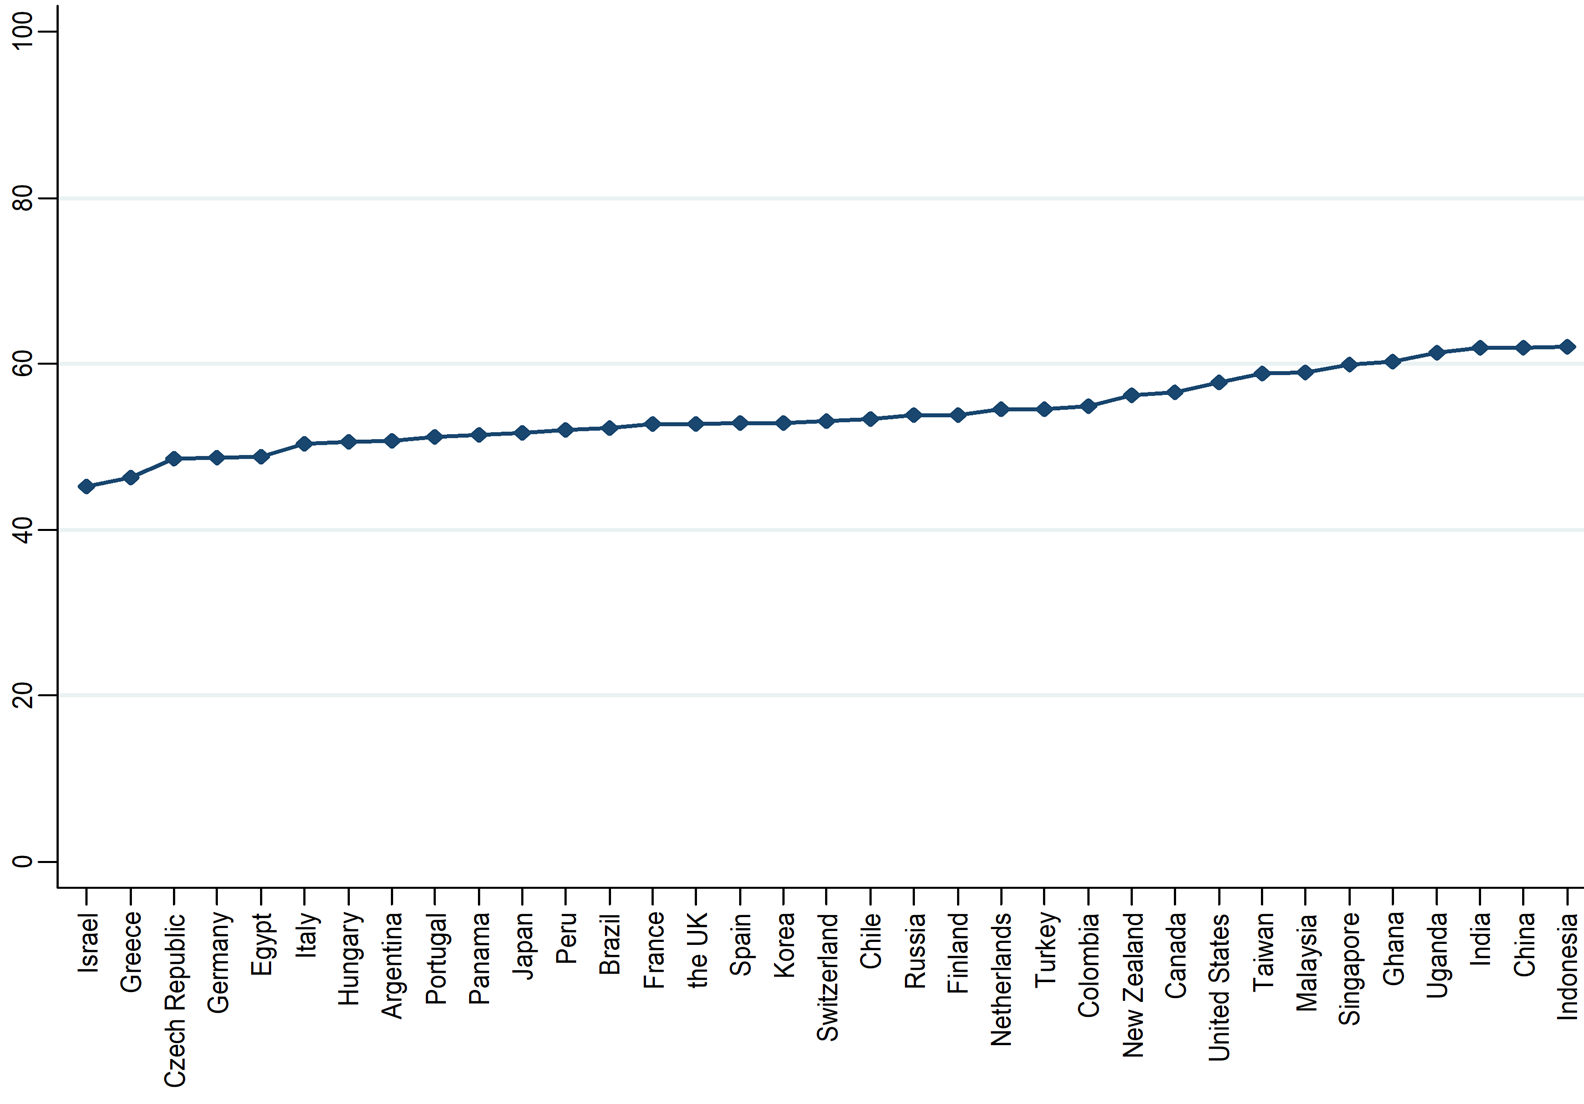
Figure 3
Mean Explicit Teacher Status scores across countries
Explicit Teacher Status
Our third measure of teacher status is based on participants’ explicit responses to questions about the characteristics of teachers and teaching. Respondents were asked to what extent they agreed or disagreed with the following nine propositions concerning the working conditions, abilities, and professionalism of teachers:
- Being an effective teacher requires rigorous training.
- It is too easy to become a teacher.
- The quality of teachers is too variable.
- Pupils respect teachers in my country.
- The teachers in my children’s school are respected by their pupils.
- Teachers work hard.
- Teachers enjoy a positive media image.
- Teachers have long holidays.
- Teachers have the autonomy to exercise their professional judgement.
Response options were: Strongly Agree, Tend To Agree, Neither Agree Nor Disagree, Tend To Disagree, Strongly Disagree. We scored these responses as follows:
- Strongly Agree (5)
- Tend To Agree (3)
- Neither Agree Nor Disagree (0)
- Tend To Disagree (-3)
- Strongly Disagree (-5)
The statements given in red text in the list above were considered to indicate a negative view of teachers (where the rest of the statements indicated a positive view). Responses to these statements were therefore scored in the reverse direction.
To these nine items we added a tenth (scoring indicated in parentheses):
“Imagine you had children. To what extent do you think you would encourage or not encourage them to become a teacher?”
- Definitely Encourage (5)
- Probably Encourage (3)
- Maybe Encourage (0)
- Probably Not Encourage (-3)
- Definitely Not Encourage (-5)
The scores on these 10 items were summed, then rescaled to give a score from 0 to 100.
Figure 3 shows the average of this score across the countries in our sample.
Table 2 shows the extent of the correlation between our three measures of teacher status. Focusing first on the Ranking Measure, this table shows that the rank accorded to primary and secondary teachers is strongly correlated (0.55). People who rank secondary school teachers highly also tend to rank primary school teachers highly. However, ranking of primary and secondary school teachers is much more weakly correlated with the ranking of headteachers, suggesting that the extent to which headteachers are respected is to some extent separable from the respect accorded to the main body of the teaching profession.
Table 2 also shows that there is a strong correlation (0.52) between our implicit and explicit measures of teacher status. This suggests that, despite the differences in the way they are measured, these two measures may be capturing a common underlying concept. The correlation between these measures and the ranking measure is, however, much lower. This suggests that these two sets of measures may be capturing different elements of teacher status. It is plausible that our explicit and implicit measures are capturing respondents’ evaluations (explicit and implicit, respectively) of teacher attributes and characteristics. Whereas our ranking measure focuses more strongly on prestige and respect. The distinction between these concepts is clear if we recognise that a respondent may easily consider teachers to be good at their jobs (competent, trustworthy, inspiring, well-trained, etc.) while still feeling that they are not highly respected relative to other professionals.
Table 2: Correlations between the different measures of teacher status (Pearson’s R) in the full non-teacher sample
| Rank (Primary) | Rank (Secondary) | Rank (Head) | Implicit status | Explicit status | ||||||
|---|---|---|---|---|---|---|---|---|---|---|
| Rank (Primary) | - | - | - | - | - | Rank (Primary): - | Rank (Secondary): 0.55 | Rank (Head): 0.18 | Implicit status: 0.20 | Explicit status: 0.17 |
| Rank (Secondary) | 0.55 | - | - | - | - | Rank (Primary): 0.55 | Rank (Secondary): - | Rank (Head): 0.23 | Implicit status: 0.23 | Explicit status: 0.18 |
| Rank (Head) | 0.18 | 0.23 | - | - | - | Rank (Primary): 0.18 | Rank (Secondary): 0.23 | Rank (Head): - | Implicit status: 0.13 | Explicit status: 0.10 |
| Implicit status | 0.20 | 0.23 | 0.13 | - | - | Rank (Primary): 0.20 | Rank (Secondary): 0.23 | Rank (Head): 0.13 | Implicit status: - | Explicit status: 0.52 |
| Explicit status | 0.17 | 0.18 | 0.10 | 0.52 | - | Rank (Primary): 0.17 | Rank (Secondary): 0.18 | Rank (Head): 0.10 | Implicit status: 0.52 | Explicit status: - |
Relationship Between Perceived Status and Perceived Pay
In addition to being asked to rank teachers in terms of their perceived status, GTSI 2018 respondents were also asked to rank them against the same professions in terms of their perceived pay. It is possible that people’s answers to these questions may influence each other. For example, respondents who rank teachers highly in terms of perceived respect may feel obligated, through a sense of consistency, to rank them highly in terms of perceived pay as well. To account for this possibility, a random half of the sample was asked the pay question before the respect question, and vice-versa.
Table 3 shows the correlations between the pay and respect questions for the full sample. This table re-affirms the disconnection between primary and secondary teachers on the one hand and headteachers on the other. The perceived pay of primary teachers is highly correlated with the perceived pay of secondary teachers, but the pay perceptions of both of these groups are only weakly correlated with the perceived pay of headteachers.
Table 3 also shows that there is only a moderate correlation between perceived pay and perceived respect for the three groups of teachers. This suggests perceptions of pay and respect are not strongly connected. Respondents recognise that while teachers may be highly respected, they may not be highly paid (or vice-versa).
We proceeded to repeat the same analysis separately for those respondents who answered the pay question first and for those who answered the respect question first. Our results show that the correlations are consistently higher among respondents who were asked the respect question first. This suggests that first asking respondents to consider the extent that teachers are respected encourages them to bring their responses on pay more closely in line with their respect ranking.
Table 3: Correlations between perceived teacher pay and perceived teacher status (Pearson’s R) in the full non-teacher sample
| Respect (Primary) | Pay (Primary) | Respect (Secondary) | Pay (Secondary) | Respect (Head) | Pay (Head) | |||||||
|---|---|---|---|---|---|---|---|---|---|---|---|---|
| Respect (Primary) | - | - | - | - | - | - | Respect (Primary): - | Pay (Primary): 0.29 | Respect (Secondary): 0.55 | Pay (Secondary): 0.20 | Respect (Head): 0.18 | Pay (Head): 0.09 |
| Pay (Primary) | 0.29 | - | - | - | - | - | Respect (Primary): 0.29 | Pay (Primary): - | Respect (Secondary): 0.21 | Pay (Secondary): 0.51 | Respect (Head): 0.04 | Pay (Head): 0.13 |
| Respect (Secondary) | 0.55 | 0.21 | - | - | - | - | Respect (Primary): 0.55 | Pay (Primary): 0.21 | Respect (Secondary): - | Pay (Secondary): 0.27 | Respect (Head): 0.23 | Pay (Head): 0.13 |
| Pay (Secondary) | 0.20 | 0.51 | 0.27 | - | - | - | Respect (Primary): 0.20 | Pay (Primary): 0.51 | Respect (Secondary): 0.27 | Pay (Secondary): - | Respect (Head): 0.09 | Pay (Head): 0.19 |
| Respect (Head) | 0.18 | 0.04 | 0.23 | 0.09 | - | - | Respect (Primary): 0.18 | Pay (Primary): 0.04 | Respect (Secondary): 0.23 | Pay (Secondary): 0.09 | Respect (Head): - | Pay (Head): 0.30 |
| Pay (Head) | 0.09 | 0.13 | 0.13 | 0.19 | 0.30 | - | Respect (Primary): 0.09 | Pay (Primary): 0.13 | Respect (Secondary): 0.13 | Pay (Secondary): 0.19 | Respect (Head): 0.30 | Pay (Head): - |
[1] The order of this list was randomised to ensure that responses were not biased by the order in which occupations were listed.